Overview
Certara.ModelResults is an R package and Shiny GUI used to generate, customize, and report model diagnostic plots and tables from NLME or NONMEM runs.
Users are not limited by the GUI however, Certara.ModelResults will generate the underlying flextable and xpose/ggplot2 code (.R and/or .Rmd) for you inside the Shiny application, which you can then use to recreate your plot and table objects in R, ensuring reproducibility and traceability of model diagnostics for reporting output.
Installation
Windows
install.packages("Certara.ModelResults",
                 repos = c("https://certara.jfrog.io/artifactory/certara-cran-release-public/",
                           "https://cloud.r-project.org"),
                 method = "libcurl")
Linux
install.packages("Certara.ModelResults",
                 repos = c("https://certara.jfrog.io/artifactory/certara-cran-release-public/",
                           "https://cloud.r-project.org"))
Usage
Certara.ModelResults supports both NLME and NONMEM output files. You can use the built in example xpose_data objects (xpdb_NLME and xpdb_NONMEM) in the package to explore functionality. Simply execute the resultsUI() function from R to launch the Shiny GUI in your web browser.
library(Certara.ModelResults)

# NLME
resultsUI(xpdb = xpdb_NLME)

# NONMEM
resultsUI(xpdb = xpdb_NONMEM)
There are two methods available to initiate resultsUI() with your model output files:
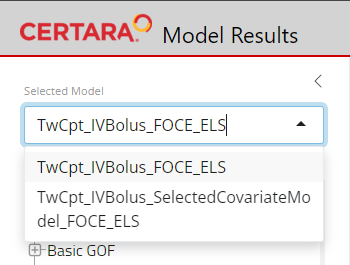
1.) Specify one or more previously executed model objects (class NlmePmlModel from Certara.RsNLME package) to model argument
library(Certara.ModelResults)
library(Certara.RsNLME)

model <- pkmodel(numCompartments = 2, data = pkData,
                ID = "Subject", Time = "Act_Time", A1 = "Amount", CObs = "Conc",
                modelName = "TwCpt_IVBolus_FOCE_ELS")

job <- fitmodel(model)


resultsUI(model = model)
2.) Specify one or more xpdb objects (class xpose_data from xpose package for NONMEM or Certara.Xpose.NLME package for NLME) to xpdb argument
NLME
library(Certara.ModelResults)
library(Certara.Xpose.NLME)

xpdb_ex_NLME <- xposeNlme(dir = "~/NLME/Two_Cpt_IVBolus_Foce-ELS", modelName = "Two_Cpt_IVBolus_Foce-ELS")

resultsUI(xpdb = xpdb_ex_NLME)
NONMEM
library(Certara.ModelResults)
library(xpose)

xpdb_ex_NONMEM <- xpose_data(runno = "001", dir = "~/NONMEM/One_Cpt_FirstOrder")

resultsUI(xpdb = xpdb_ex_NONMEM)
Features
- Supports RsNLME, Phoenix NLME, and NONMEM model output files
- Generate R and R Markdown code for model diagnostics from Shiny GUI
- Create diagnostic plots using
xposeandggplot2 - Create diagnostic tables using
flextable - Interactive plot visualizations using
plotly - Render model diagnostic output to word, pdf, or html
…and more!
Reporting
With Certara.ModelResults you can create output reports from your tagged model diagnostics inside the Shiny GUI. After tagging various model diagnostic plots or tables, navigate to the REPORT tab and drag one or more tagged diagnostics to the Report Output container.
Custom MS Word style template
Does your organization have their own MS Word style template? Use a custom style template with Certara.ModelResults by overwriting the default style template at the following location C:\Program Files\R\R-4.0.5\library\Certara.ModelResults\extdata\report_template.docx. Make sure to save your new template with the name report_template.docx.
Note: The path C:\Program Files\R\R-4.0.5\library\Certara.ModelResults\extdata\report_template.docx is only valid for a R 4.0.5 installation on Windows. Depending on your operating system and version of R, the path may be different
Learn more about using a style template with Certara.ModelResults here.
System Requirments
In order to render reports to pdf, the rmarkdown package requires a LaTeX distribution available on the system. You can easily install this in R using the command below:
install.packages('tinytex')
tinytex::install_tinytex()