Overview
Certara.VPCResults is an R package and Shiny application used to parameterize and plot a Visual Predictive Check (VPC).
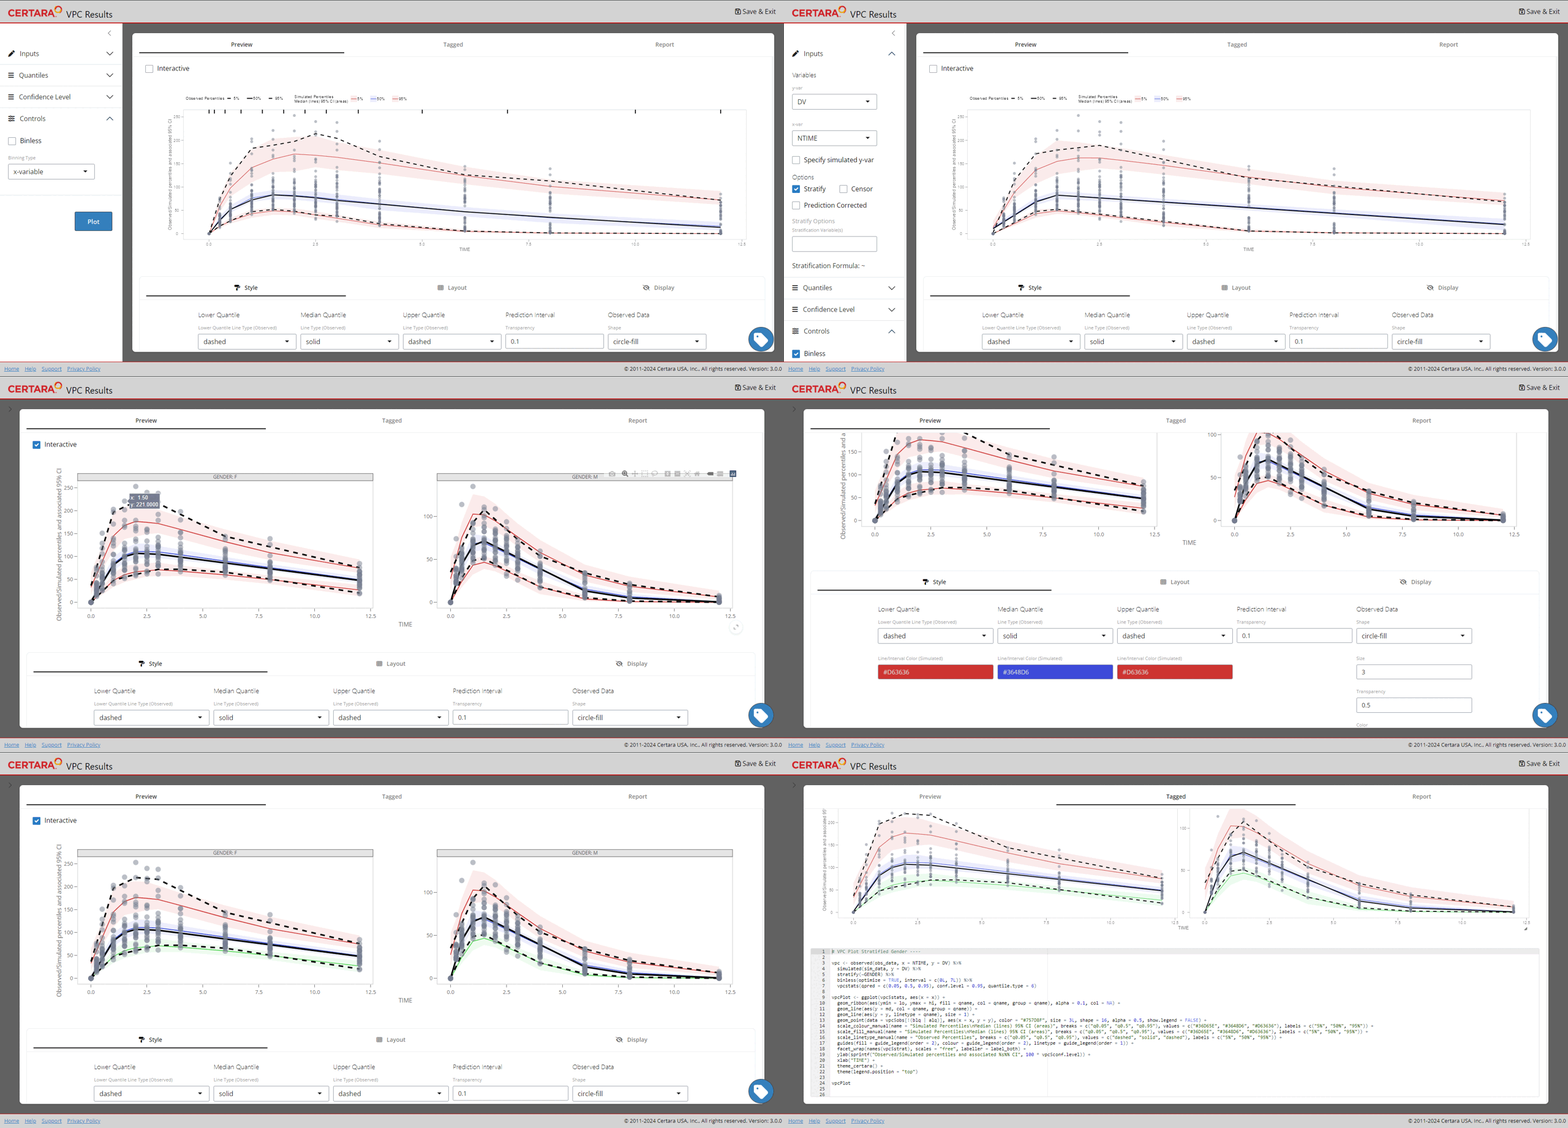
Use the GUI to select from various binning or binless methods and specify options such as censoring, stratification, and prediction-corrected.
Users are not limited by the GUI however, Certara.VPCResults will generate the underlying tidyvpc and ggplot2 code (.R and/or .Rmd) for you inside the Shiny application, which you can then use to recreate your plot and table objects in R, ensuring reproducibility and traceability of VPC’s for reporting output.
Installation
install.packages("Certara.VPCResults",
  repos = c("https://certara.jfrog.io/artifactory/certara-cran-release-public/",
  "https://cloud.r-project.org"), method = "libcurl")
Usage
Certara.VPCResults supports both NLME and NONMEM VPC output files. The data requirements to use Certara.VPCResults are the same as the tidyvpc package:
- DV cannot be missing in observed/simulated data i.e. subset
MDV == 0 - Observed data must be ordered by: Subject-ID, IVAR (Time)
- Simulated data must be ordered by: Replicate, Subject-ID, IVAR (Time)
Use the built in data objects from the tidyvpc package to explore functionality inside Certara.VPCResults.
library(Certara.VPCResults)
library(tidyvpc)

vpcResultsUI(observed = obs_data, simulated = sim_data)
Features
- Supports RsNLME, Phoenix NLME, and NONMEM model output files
- Traditional binning and new binless methods using the
tidyvpcpackage - Support for continuous and categorical DV
- Generate R and R Markdown code for VPC generation from Shiny GUI
- Create and customize diagnostic plots using
ggplot2 - Interactive plot visualizations using
plotly - Render model diagnostic output to word, pdf, or html
…and more!
Reporting
With Certara.VPCResults you can create output reports from your tagged model diagnostics inside the Shiny GUI. After tagging various model diagnostic plots or tables, navigate to the REPORT tab and drag one or more tagged diagnostics to the Report Output container.
Custom MS Word style template
Does your organization have their own MS Word style template? Use a custom style template with Certara.VPCResults by overwriting the default report_template.docx in your R package library e.g., C:\Program Files\R\R-4.0.5\library\Certara.VPCResults\extdata\report_template.docx.
Make sure to save your new template with the name report_template.docx.
Learn more about using a style template with Certara.VPCResults here.
System Requirements
In order to render reports to pdf, the rmarkdown package requires a LaTeX distribution available on the system. You can easily install this in R using the command below:
install.packages('tinytex')
tinytex::install_tinytex()