Build multiple plots for selected variable vs covariates
nlme.var.vs.cov.RdThe type of plot depends on the type of covariate: boxplot for categorical, geom_point and geom_smooth for continuous.
Arguments
- xpdb
An xpose database object.
- covColNames
Character vector of covariates to build the matrix.
- nrow
Number of rows.
- ncol
Number of columns; if ncol=1, each gtable object is treated separately.
- yVar
Variable from xpdb data to build a plot.
- ...
Parameters to be passed to
ggarrange()
Value
List of gtable
Examples
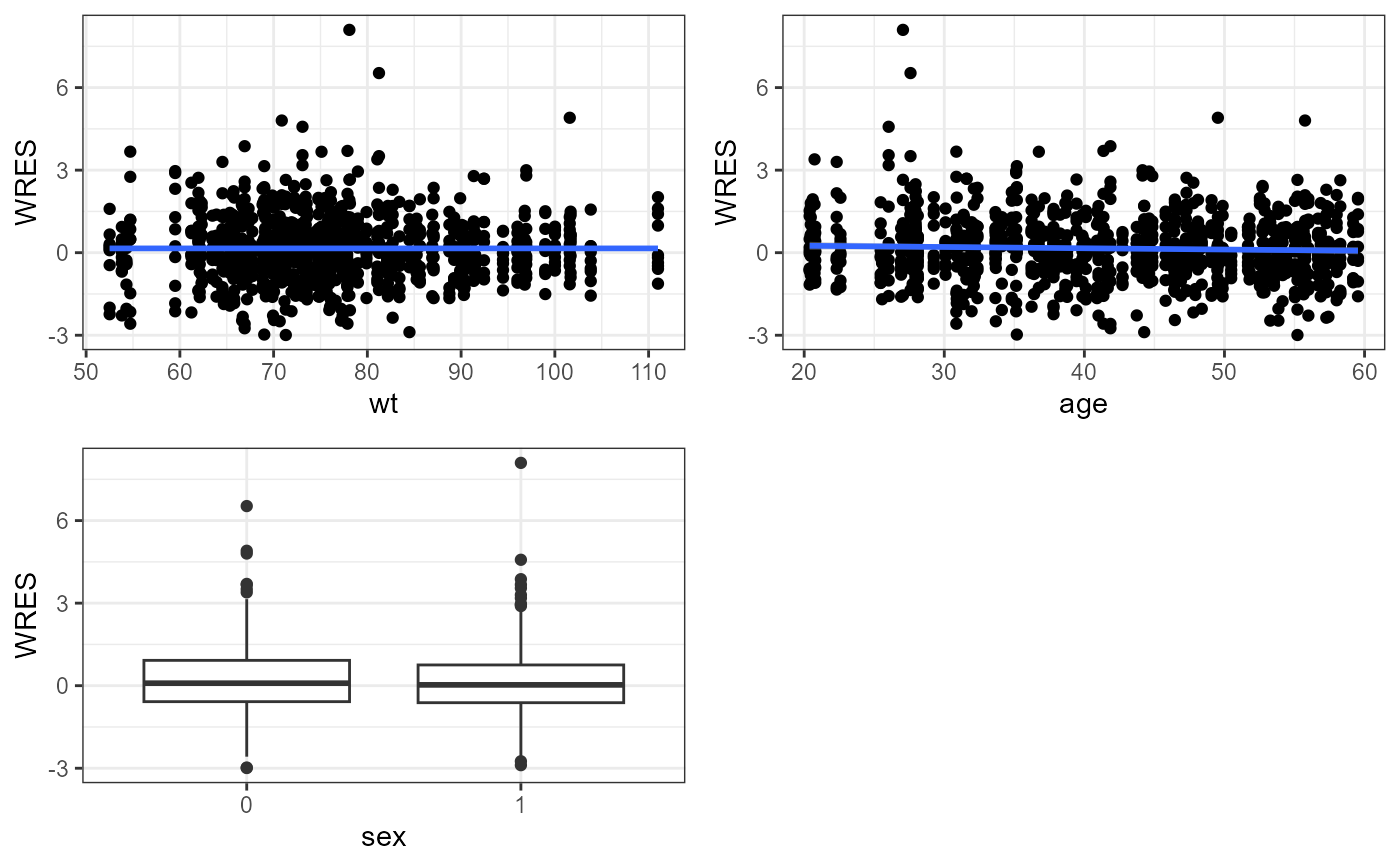
nlme.var.vs.cov(
  xpdb = xpdb_ex_Nlme,
  covColNames = c("sex", "wt", "age"),
  yVar = "WRES",
  nrow = 2,
  ncol = 2
  )
#> Warning: Removed 100 rows containing non-finite outside the scale range
#> (`stat_smooth()`).
#> Warning: Removed 100 rows containing missing values or values outside the scale range
#> (`geom_point()`).
#> Warning: Removed 100 rows containing non-finite outside the scale range
#> (`stat_smooth()`).
#> Warning: Removed 100 rows containing missing values or values outside the scale range
#> (`geom_point()`).
#> Warning: Removed 100 rows containing non-finite outside the scale range
#> (`stat_boxplot()`).
#> adding dummy grobs

#> [[1]]

#>
#>