Overview
Certara.Xpose.NLME is an R package used to creates xpose databases (xpose_data) for PML/NLME results. Additionally, Certara.Xpose.NLME offers various covariate model diagnostic functions, not available in the xpose package.
Installation
Windows
install.packages("Certara.Xpose.NLME",
                 repos = c("https://certara.jfrog.io/artifactory/certara-cran-release-public/",
                           "https://cloud.r-project.org"),
                 method = "libcurl")
Linux
install.packages("Certara.Xpose.NLME",
                 repos = c("https://certara.jfrog.io/artifactory/certara-cran-release-public/",
                           "https://cloud.r-project.org"))
Features
- Create an
xpose_dataobject from NLME model execution directory/files, compatible withxposefunctions - Includes model diagnostic functions for categorical and continuous covariates
- Includes functions to extract estimates from model output into a
data.framefor table formatting
Usage
library(Certara.RsNLME)
library(Certara.Xpose.NLME)
library(xpose)
library(ggplot2)


# Create two-compartment pharmacokinetic model
model <- pkmodel(numCompartments = 2, data = pkData,
                ID = "Subject", Time = "Act_Time", A1 = "Amount", CObs = "Conc",
                modelName = "TwCpt_IVBolus_FOCE_ELS")

# Update parameters and residual error
model <- model |>
  structuralParameter(paramName = "V2", hasRandomEffect = FALSE) |>
  fixedEffect(effect = c("tvV", "tvCl", "tvV2", "tvCl2"), value = c(15, 5, 40, 15)) |>
  randomEffect(effect = c("nV", "nCl", "nCl2"), value = rep(0.1, 3)) |>
  residualError(predName = "C", SD = 0.2)

# Fit model
job <- fitmodel(model)

# Create xpose_data object from model + fit objects in R using xposeNlmeModel()
xp <- xposeNlmeModel(model, job)

# Alternatively, create xpose_data object from model output directory using xposeNlme()
xp <- xposeNlme(dir = "./TwCpt_IVBolus_FOCE_ELS", modelName = "TwCpt_IVBolus_FOCE_ELS")

# Use xpose plotting function with theme from ggplot2
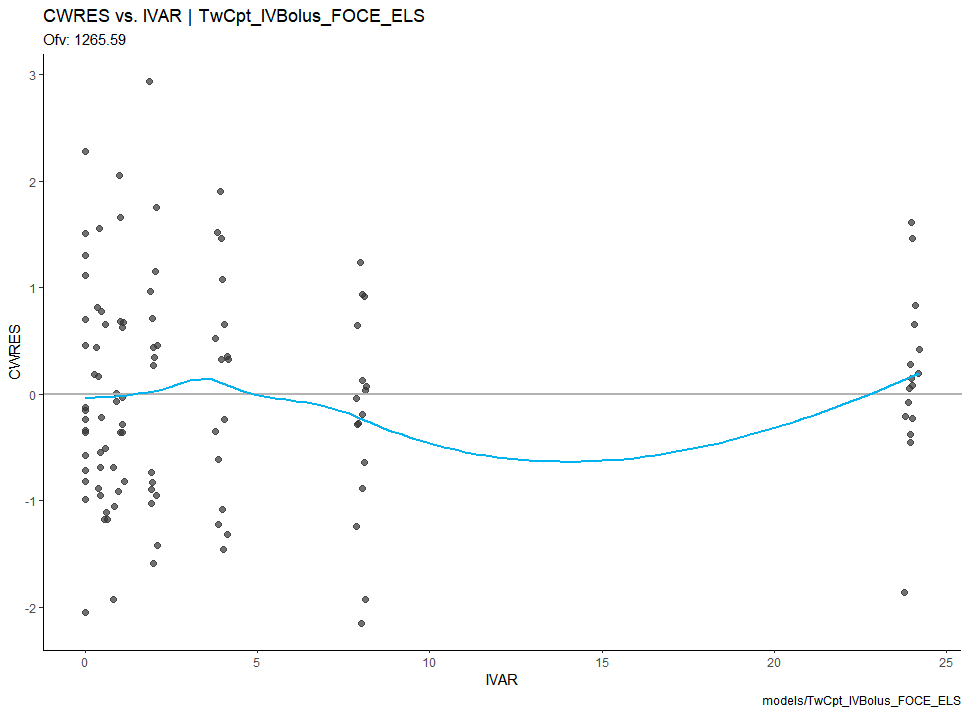
res_vs_idv(xpdb) +
  theme_classic()
