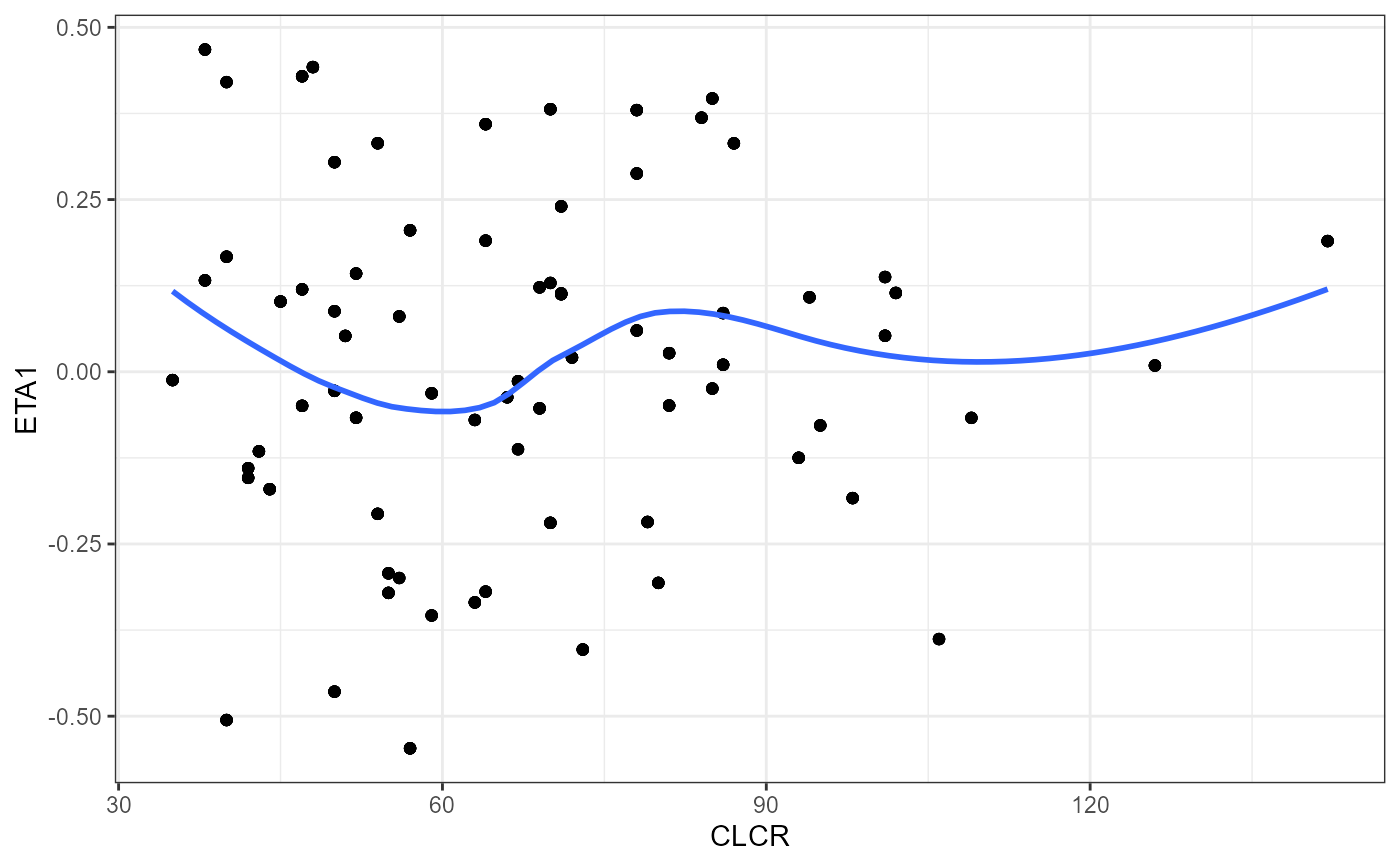
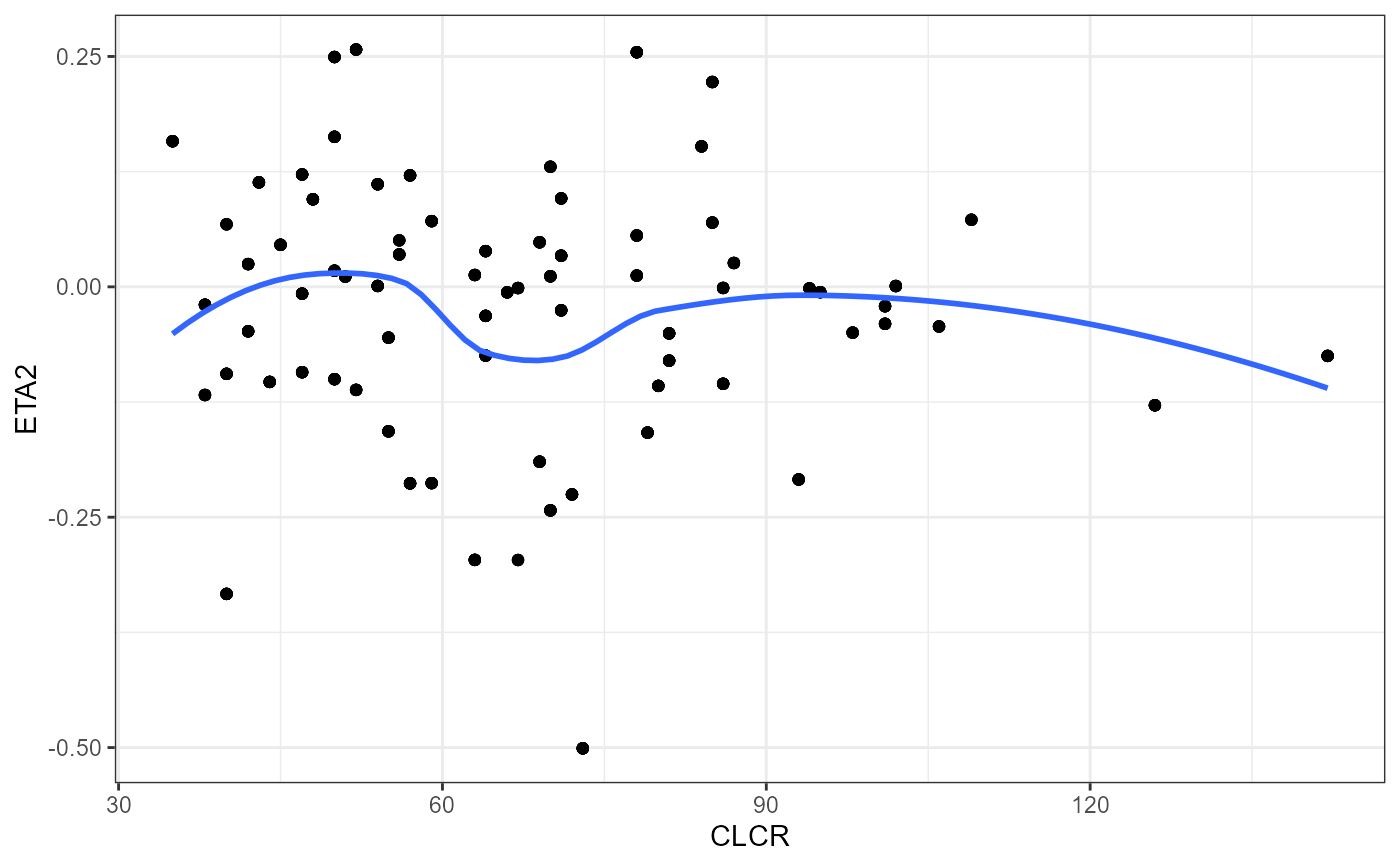
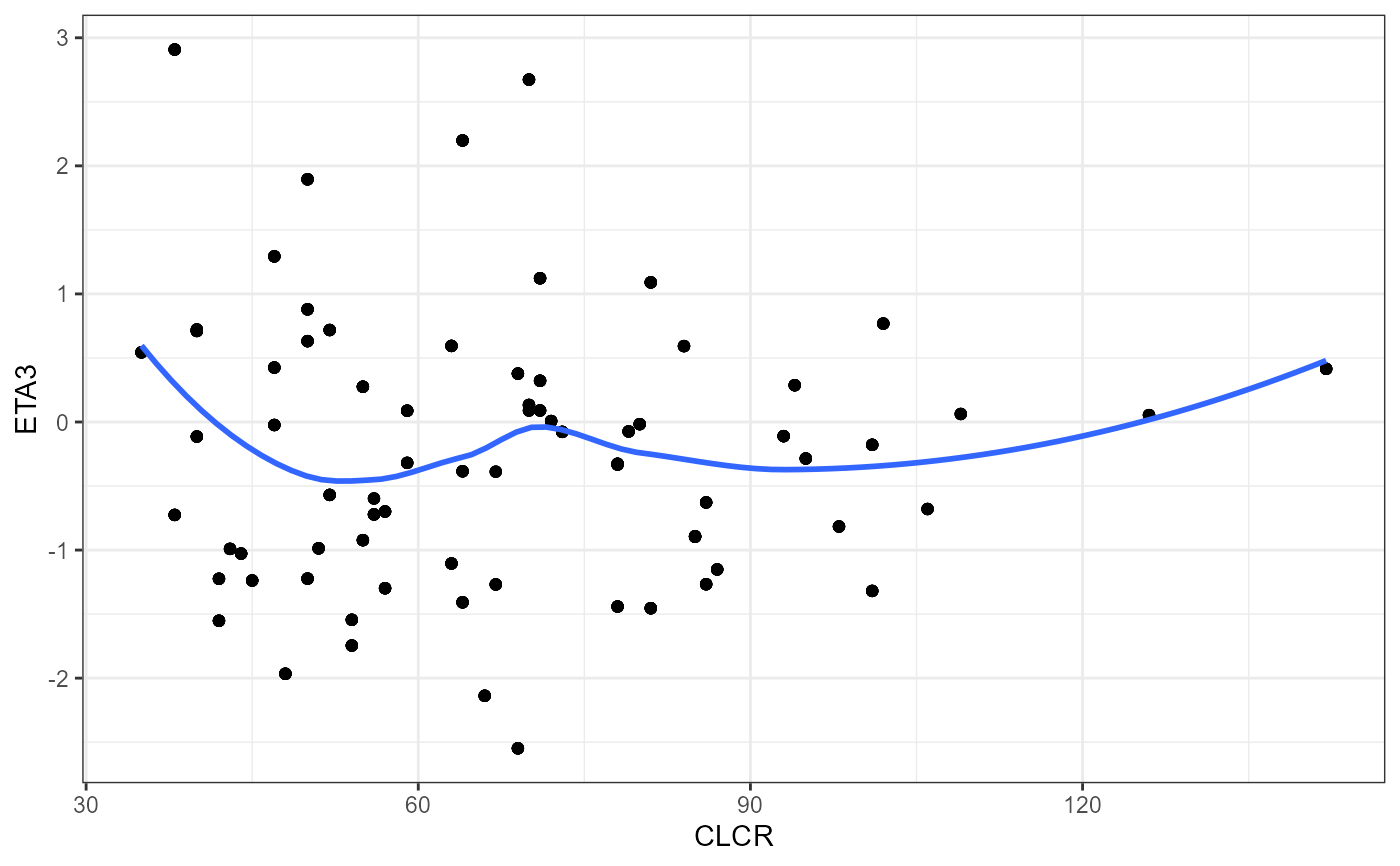
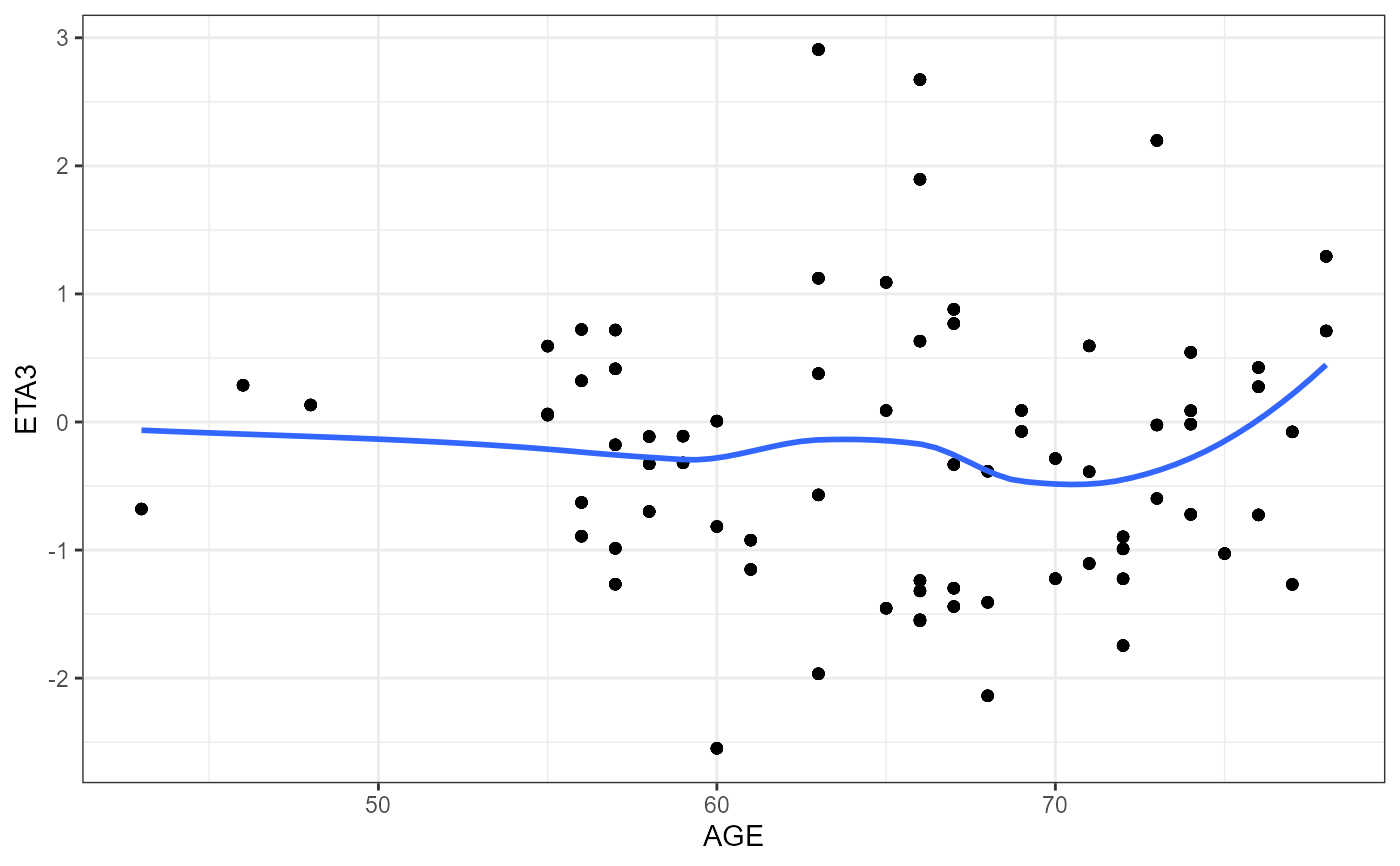
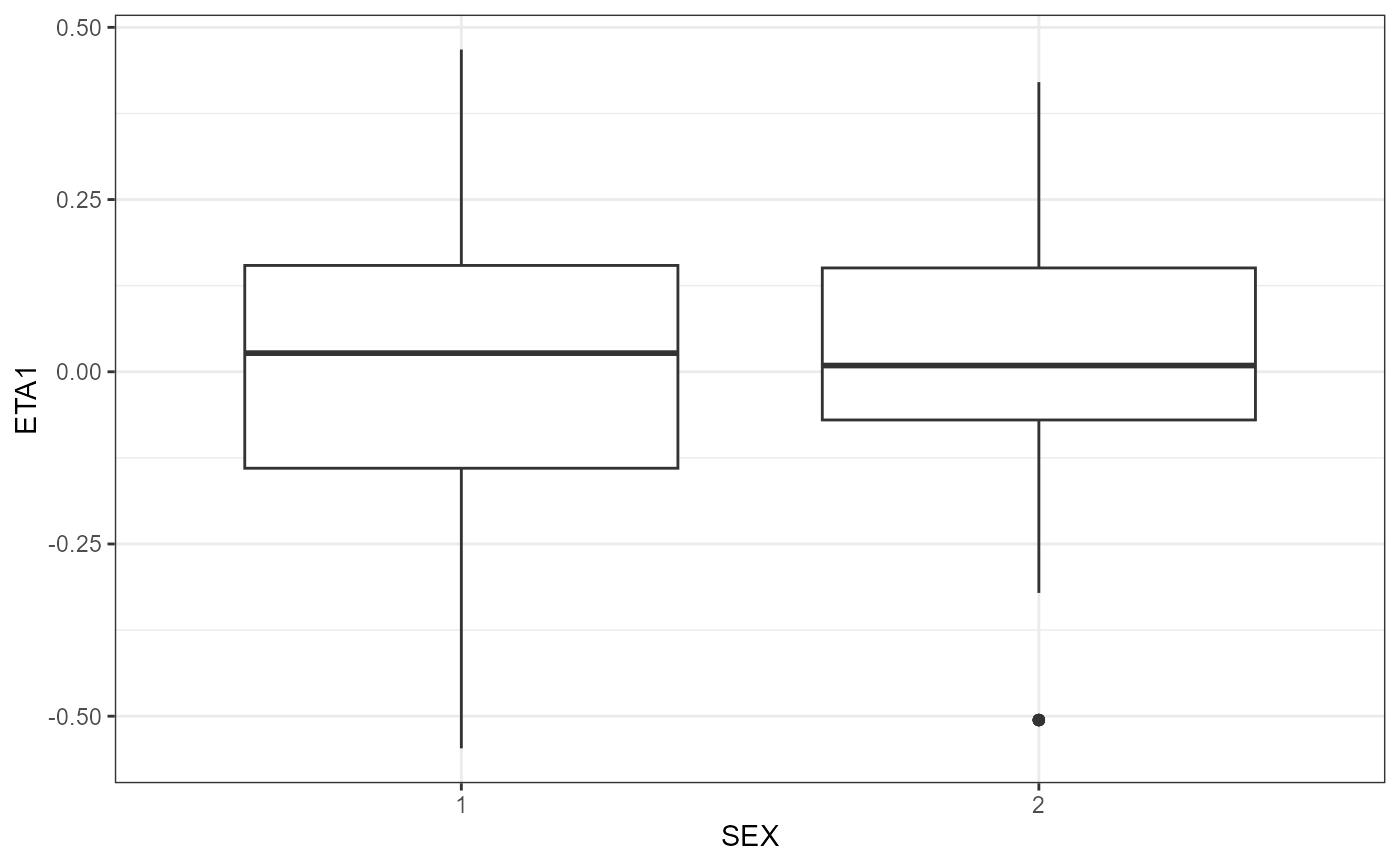
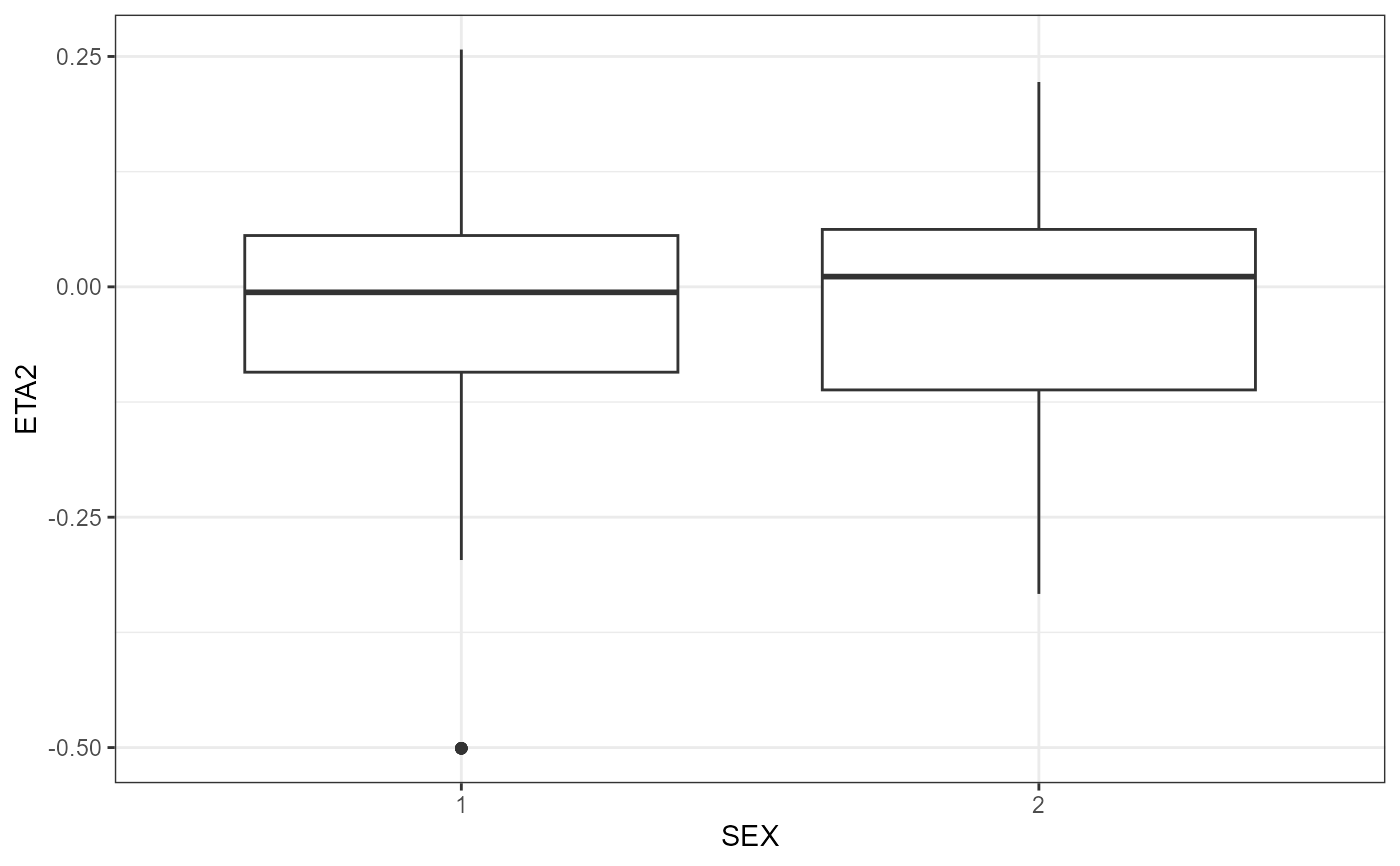
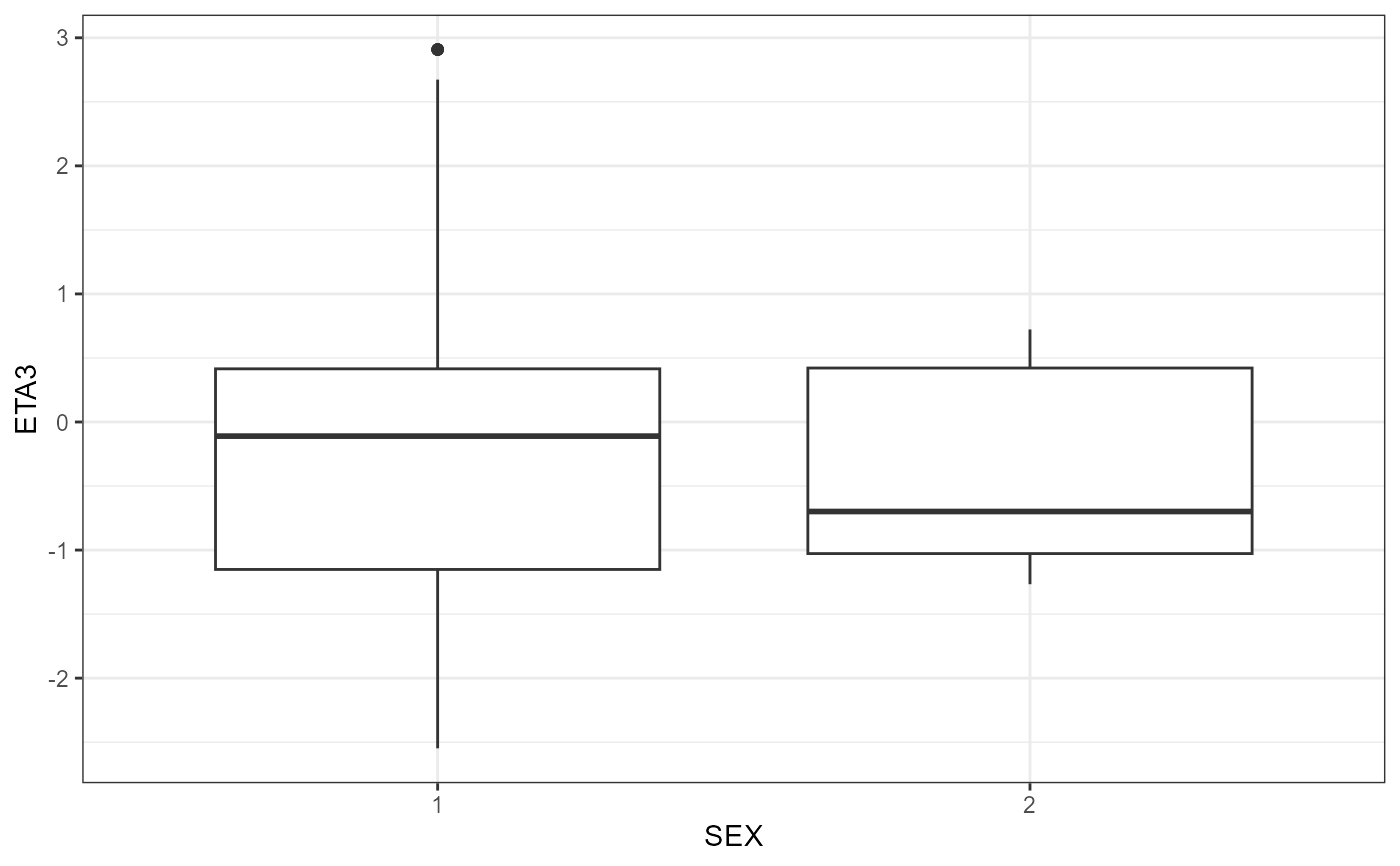
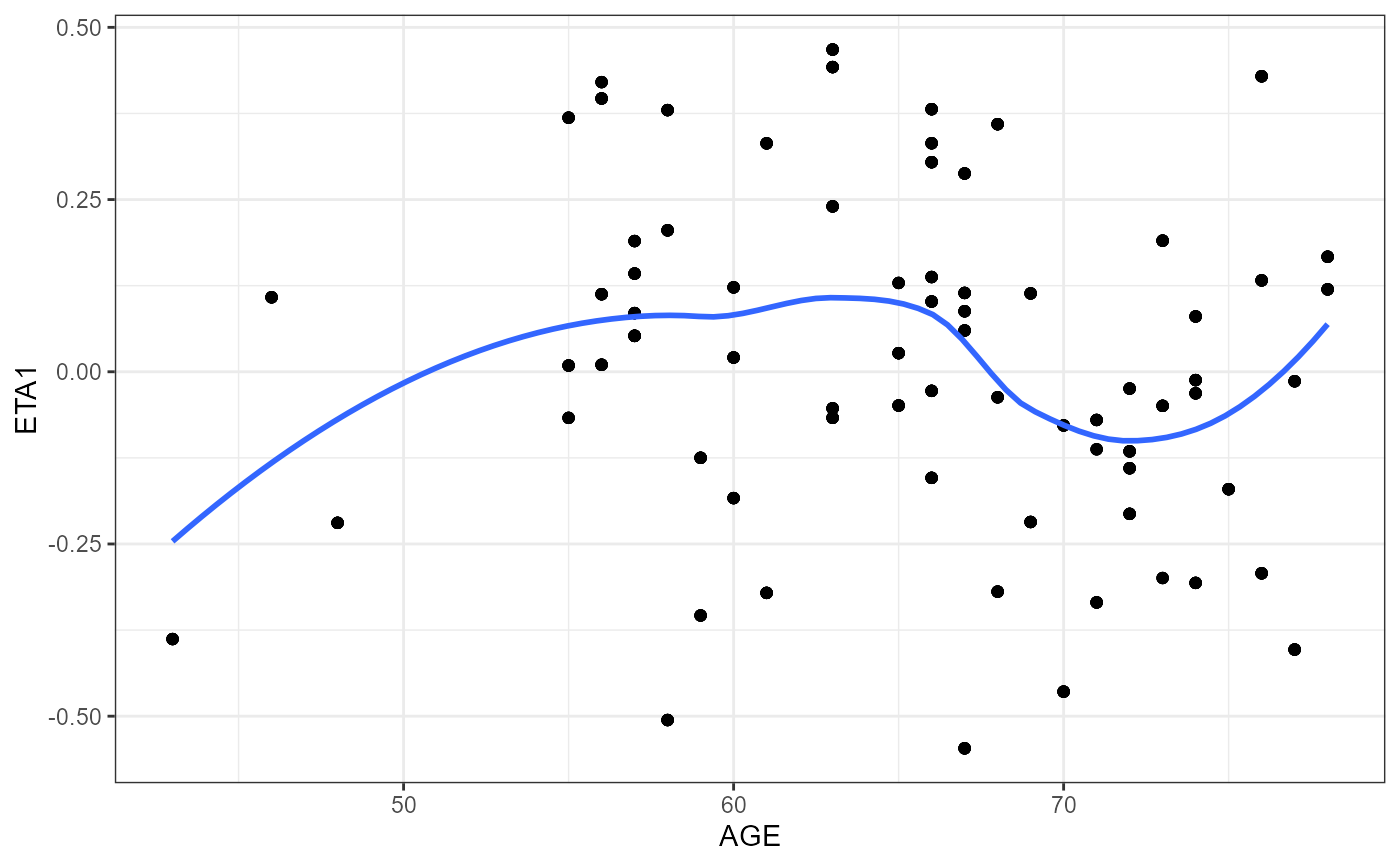
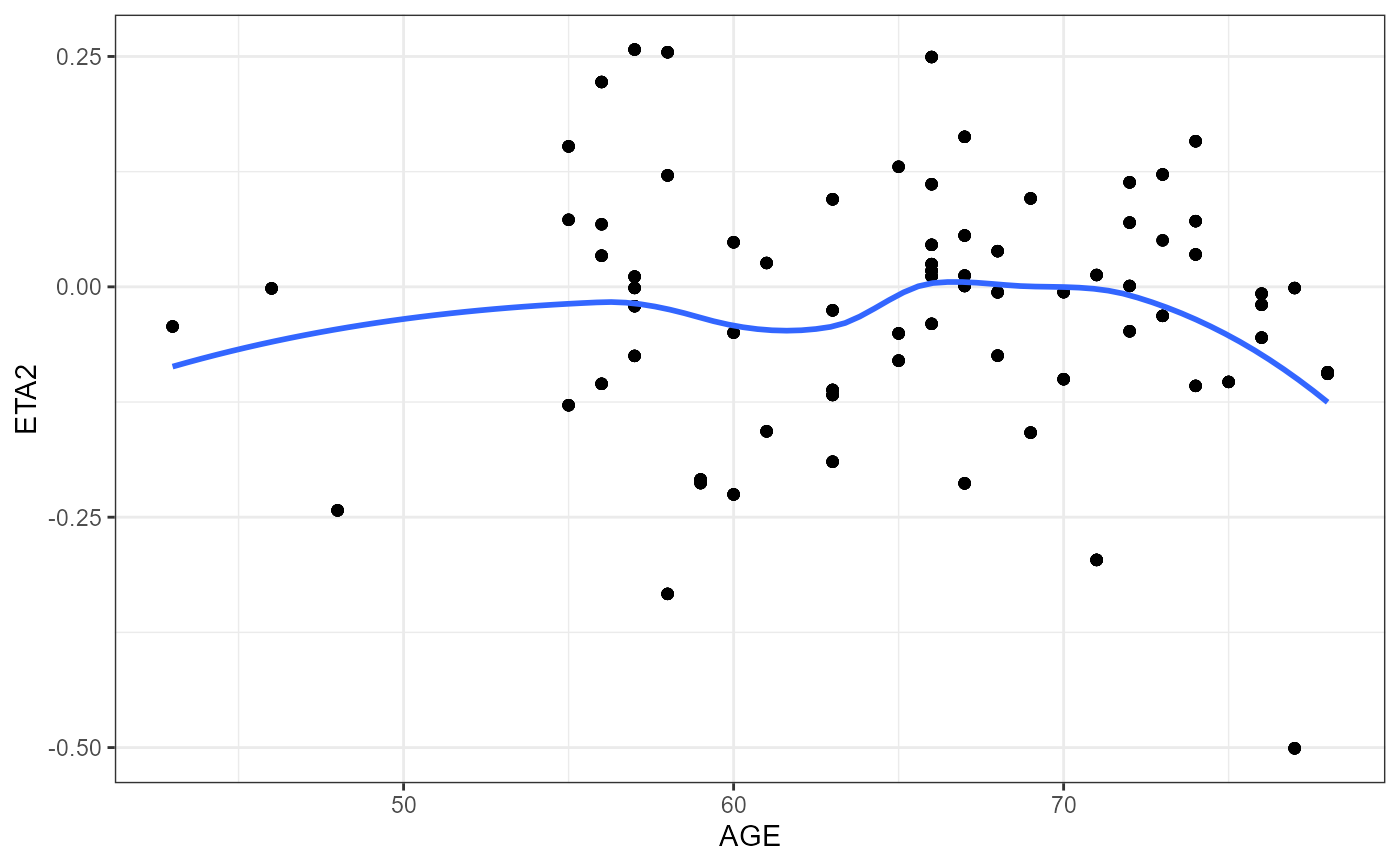
Plot random parameter estimates against covariates
nlme.ranpar.vs.cov.RdUse to create a stack of plots of random parameter estimates plotted against covariates.
Arguments
- xpdb
An xpose database object.
- covColNames
Character vector of covariates to build the matrix.
- nrow
Number of rows.
- ncol
Number of columns; if ncol=1, each gtable object is treated separately.
- ...
Parameters to be passed to
ggarrange()
Value
List of gtable
Examples
nlme.ranpar.vs.cov(xpdb = xpose::xpdb_ex_pk,
covColNames = c("SEX", "CLCR", "AGE")
)
#> `geom_smooth()` using method = 'loess' and formula = 'y ~ x'
 #> `geom_smooth()` using method = 'loess' and formula = 'y ~ x'
 #> `geom_smooth()` using method = 'loess' and formula = 'y ~ x'
 #> `geom_smooth()` using method = 'loess' and formula = 'y ~ x'
 #> `geom_smooth()` using method = 'loess' and formula = 'y ~ x'
 #> `geom_smooth()` using method = 'loess' and formula = 'y ~ x'
 #> [[1]]
 #>
#> [[2]]
#>
#> [[2]]
 #>
#> [[3]]
#>
#> [[3]]
 #>
#> [[4]]
#>
#> [[4]]
 #>
#> [[5]]
#>
#> [[5]]
 #>
#> [[6]]
#>
#> [[6]]
 #>
#> [[7]]
#>
#> [[7]]
 #>
#> [[8]]
#>
#> [[8]]
 #>
#> [[9]]
#>
#> [[9]]
 #>
#>