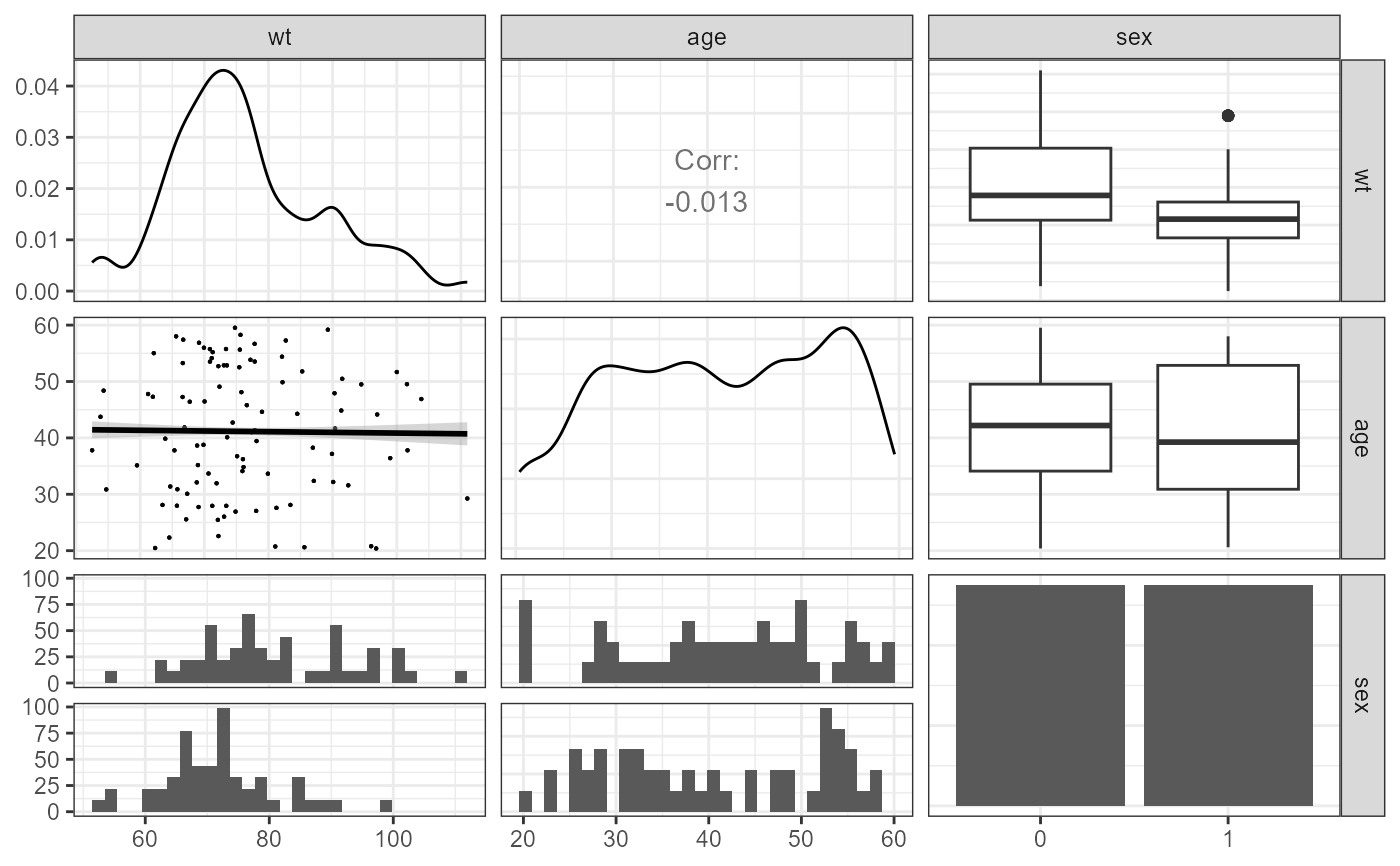
Create covariates scatterplot
nlme.cov.splom.RdUse to create covariates scatterplot.
Usage
nlme.cov.splom(
  xpdb,
  covColNames,
  ggupper = list(continuous = "cor", combo = "box_no_facet", discrete = "count", na =
    "na"),
  gglower = list(continuous = GGally::wrap("smooth", alpha = 0.3, size = 0.1), combo =
    "facethist", discrete = "facetbar", na = "na"),
  ggdiag = list(continuous = "densityDiag", discrete = "barDiag", na = "naDiag"),
  ...
)Value
ggmatrix object.
Examples
nlme.cov.splom(xpdb = xpdb_ex_Nlme,
covColNames = c("sex", "wt", "age")
)
#> `stat_bin()` using `bins = 30`. Pick better value with `binwidth`.
#> `stat_bin()` using `bins = 30`. Pick better value with `binwidth`.