Overview
A savepoint folder contains one or more files that are linked to one or more dependency files in a separate folder. Typically, files in a savepoint folder are scripts or some output from an analysis that is dependent on some other file(s), such as the raw source data.
When a dependency file is updated/revisioned, files in the savepoint folder are then considered ‘out of date’, and users are notified that these downstream files in the savepoint folder should be updated.
Savepoint folders have revision numbers. Individual files in savepoint folders can also have unique revision numbers, independent from the savepoint folder revision number.
Setup
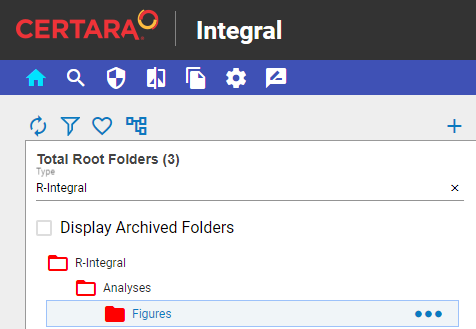
To create a savepoint folder, first, ensure that the root folder contains one or more savepoint ‘container’ folders.
folders <- get_children_of_folder(path = "R-Integral")

print(folders)
Note in the above output that the R-Integral root folder
contains a savepoint container folder named Analyses.
Next, identify a source data set to use for the analysis. In this
example, the mtcars data set will be used, which is saved
to a location in a remote Integral repository.
data <- integral_read(FUN = read.csv,
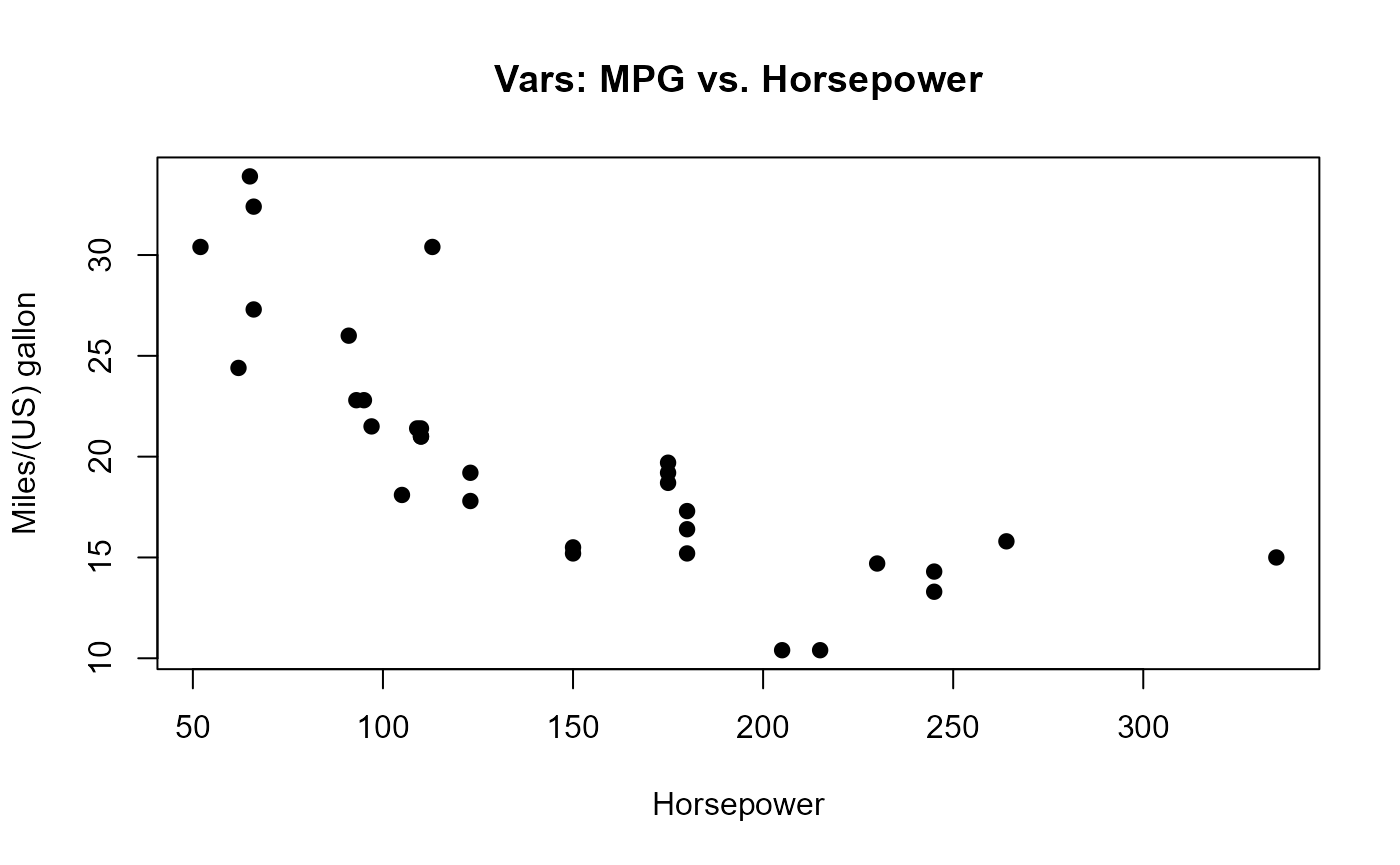
file = "R-Integral/Data/mtcars.csv")Perform some Exploratory Data Analysis (EDA) on the data, creating a few scatter plots and saving them to the working directory.
png(file = "mtcars_mpg_vs_wt.png", width = 800, height = 600)
plot(data$wt, data$mpg,
     xlab = "Weight (1000 lbs)",
     ylab = "Miles/(US) gallon",
     main = "Vars: MPG vs. Weight",
     pch = 19)
dev.off()

png(file = "mtcars_mpg_vs_hp.png", width = 800, height = 600)
plot(data$hp, data$mpg,
     xlab = "Horsepower",
     ylab = "Miles/(US) gallon",
     main = "Vars: MPG vs. Horsepower",
     pch = 19)
dev.off() 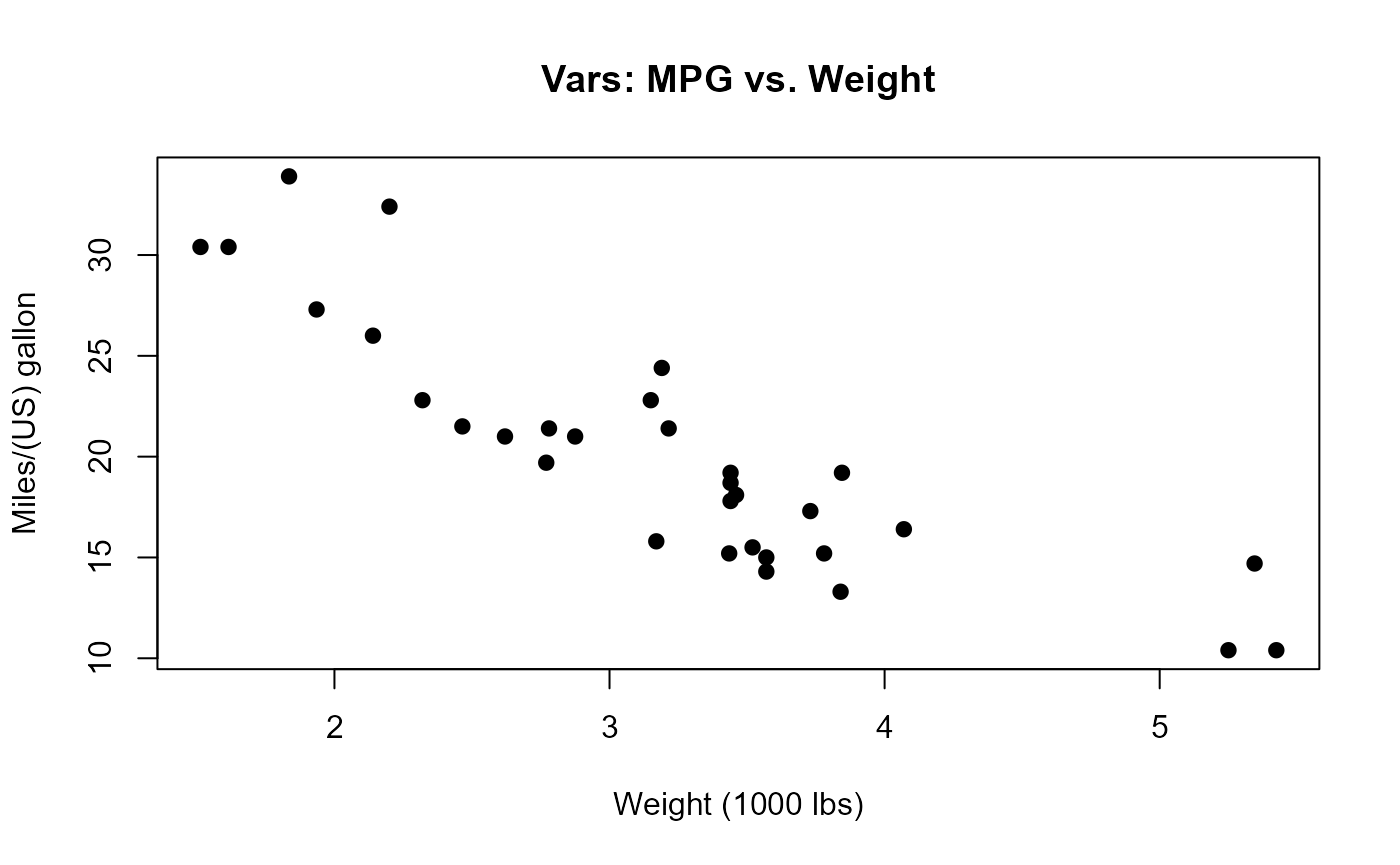
Usage
Create new savepoint
Now that a few output files are available, based on the dependency
data, the create_savepoint() function can be used to create
a new savepoint.
The name is the name of the new savepoint folder, which
becomes a subfolder of path (e.g., the Integral path to an
existing savepoint folder container). The file argument is
a character vector of paths to local files in which to upload to the
folder. The dependencies argument is a character vector,
specifying the paths to one or more dependency files in the remote
Integral repository. The type argument is used to define
the type of savepoint folder, which users can configure within Integral.
The values argument is used to pass a list of various meta
information with the savepoint, with the format being “attribute” =
“value”. Some of these fields are required, so use
?get_folder_type_attributes to check which attributes are
required and ?get_folder_type_values for permissible meta
information to be included.
create_savepoint(
  name = "Figures",
  file = c("mtcars_mpg_vs_hp.png", "mtcars_mpg_vs_wt.png"),
  path = "R-Integral/Analyses",
  dependencies = "R-Integral/Data/mtcars.csv",
  type = "Analysis",
  values = c("Analysis Type" = "Client Application",
             "Tool Version" = "R 4.3.1",
             "Status" = "Draft",
             "Description" = "initial plot upload")
)
Update existing savepoint
Next, make some changes to the data set and re-upload to Integral,
causing the R-Integral/Analyses/Figures savepoint folder to
be out of date. The plot files in the savepoint folder can then be
updated/revised based on the new data.
Import data and change mpg column value:
data <- integral_read(FUN = read.csv,
                      file = "R-Integral/Data/mtcars.csv")

data[, "mpg"] <- as.numeric(data[, "mpg"]) * runif(1)
Next, save the data back to Integral as a new revision to the
existing mtcars.csv file.
integral_write(data, FUN = write.csv, row.names = FALSE, path = "R-Integral/Data/mtcars.csv")Note that the Figures savepoint folder has now turned
red, indicating that the contents of the folder are out of date.
Now, recreate the plots with the updated data:
png(file = "mtcars_mpg_vs_wt.png", width = 800, height = 600)
plot(data$wt, data$mpg,
     xlab = "Weight (1000 lbs)",
     ylab = "Miles/(US) gallon",
     main = "Vars: MPG vs. Weight",
     pch = 19)
dev.off()

png(file = "mtcars_mpg_vs_hp.png", width = 800, height = 600)
plot(data$hp, data$mpg,
     xlab = "Horsepower",
     ylab = "Miles/(US) gallon",
     main = "Vars: MPG vs. Horsepower",
     pch = 19)
dev.off()
Finally, use the function update_savepoint() to update
the files in the existing savepoint folder. The arguments are similar to
create_savepoint(), with the only major difference being
the addition of a reason argument.
update_savepoint(
  name = "Figures",
  file = c("mtcars_mpg_vs_hp.png", "mtcars_mpg_vs_wt.png"),
  path = "R-Integral/Analyses",
  dependencies = "R-Integral/Data/mtcars.csv",
  reason = "update plots",
  values = c(
    "Analysis Type" = "Client Application",
    "Tool Version" = "R 4.3.1",
    "Status" = "Draft",
    "Description" = "test plot upload"
  )
)